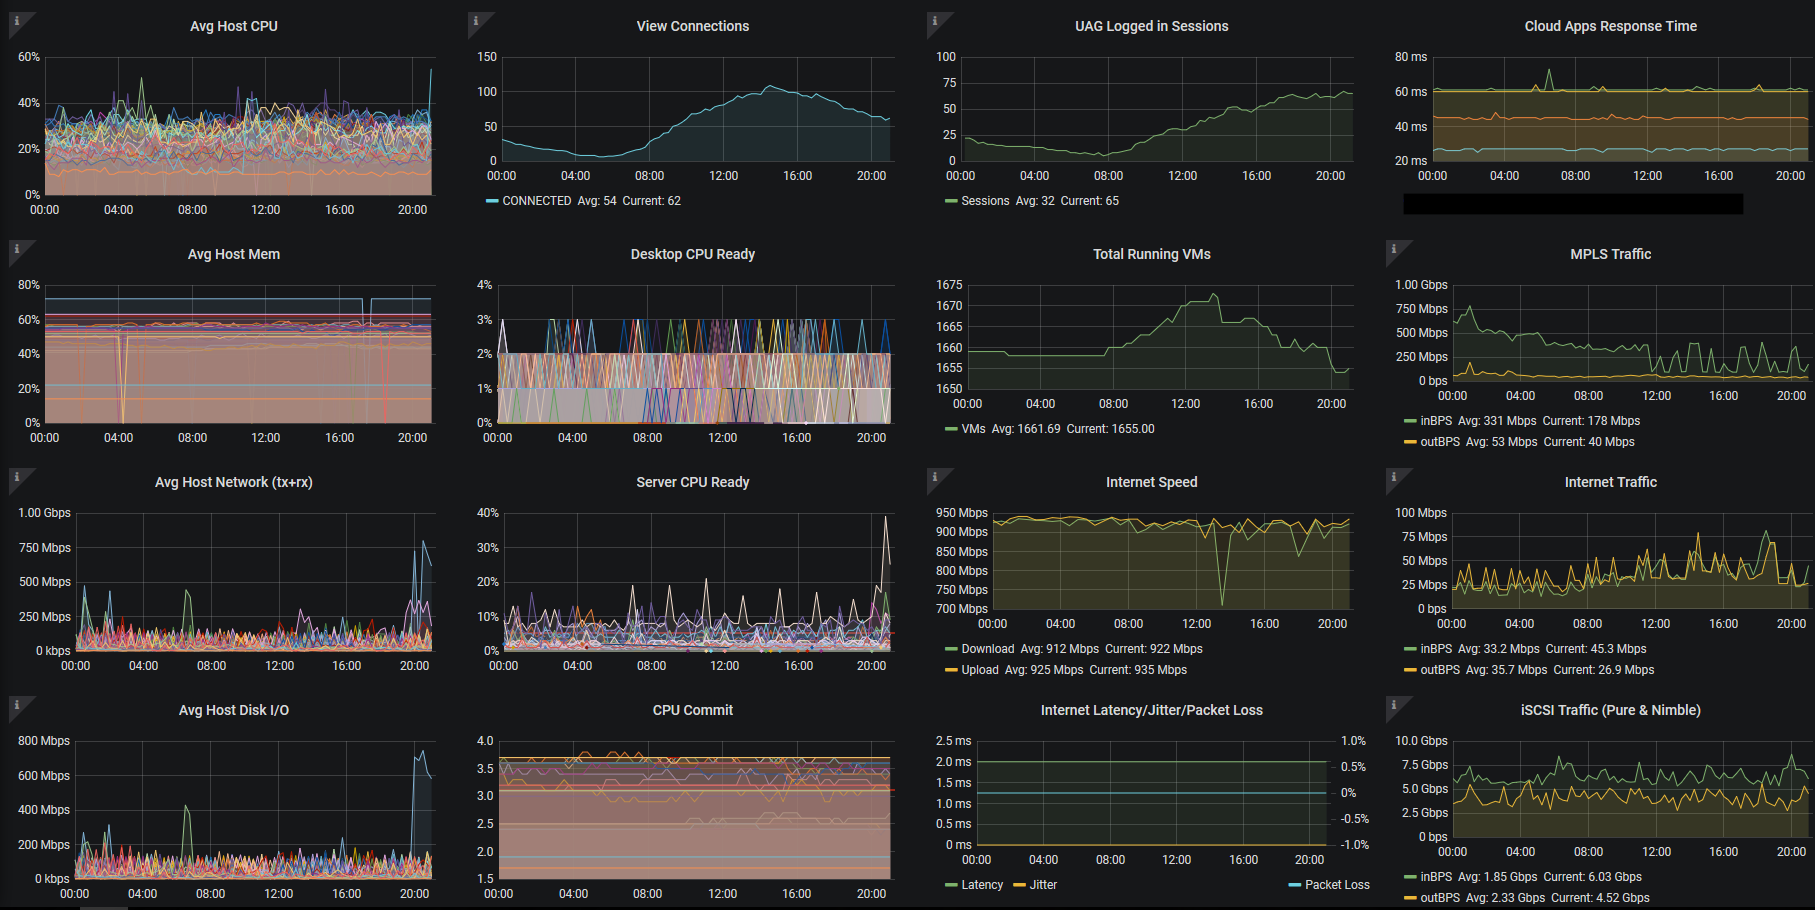
In the world of systems, trending performance data in a way that can tell you how your workload is doing can be pretty valuable. Like many employers mine has dealt with lockdowns due to COVID, but as an essential business we’ve greatly increased the number of users we have working from home on our vmWare Horizon View environment. There was a need for good insight into how the infrastructure was running but didn’t have all the tools to show details easily. Luckily, with some extra work it is possible and completely free. Fortunately (mostly for my employer) this is the kind of thing I love working on. Here is a screenshot of the end result, a single view showing the supporting workload.
This will be the first in a new series on using the Grafana graphing tool with Powershell and MariaDB. Grafana is a powerful free tool for visualizing information from nearly any data source. I’ll be posting about each of the different graphs in the dashboard and how to go about setting them up along with the code and other parts.
This post assumes you have a good understanding of way too many things, including Powershell, MariaDB/SQL, vmWare and Horizon View, and Grafana. I’m not going to try to teach you all of those things here. Here is a sample of the tech in the stack:
- Powershell 5.1 or 7 (Core)
- vmWare PowerCLI 12
- MariaDB running on CentOS 7
- phpMyAdmin to manage the database server
- Windows Server to store and run Powershell scripts
- Grafana OSS for Windows
- Solarwinds Orion Network Performance Monitor (Used for traffic and other stats)
- The SpeedTest CLI from speedtest.net – https://www.speedtest.net/apps/cli
- Horizon View
- vmWare vSphere
- vmWare Unified Access Gateway
Required Powershell modules include
- vmWare PowerCLi:
Install-Module -Name VMware.PowerCLI - SimplySQL:
Install-Module -Name SimplySQL(For connecting and working with any SQL server) - CredentialManager:
Install-Module -Name CredentialManager(Retrieves login info from Windows Credential Manager) - The VMware.Hv.Helper module: https://github.com/vmware/PowerCLI-Example-Scripts/tree/master/Modules/VMware.Hv.Helper
- PureStoragePowerShellSDK (for querying Pure flash arrays):
Install-Module -Name PureStoragePowerShellSDK - View Horizon PowerCLI – https://docs.vmware.com/en/VMware-Horizon-7/7.6/horizon-integration
To start with, I began building a single script that would gather all of the metrics for Grafana to consume. On top of that, there were a few other separate scripts that would contribute to the dataset to bring it all together. The goal is to have all data in the graphs updated every 15 minutes.
The database I use for storing data is MariaDB running on CentOS 7. I’ve already got the server installed and configured and have created a user with remote access to a database called ‘sysdata’. I’m using the SimplySQL module to access it and run queries. I use phpMyAdmin to manage the database which makes things significantly easier, and the various statistics wind up in their own table (IE; HostStats, TrafficStats, etc.). These tables all have a timestamp column set to update automatically when the data is written.
The first column in the Grafana dashboard contains metrics for all vmWare ESXi hosts in the stack. The data is polled via a scheduled task running a Powershell script to query the built in vSphere/ESXi performance counters every fifteen minutes. The script starts off with loading the appropriate modules we need;
Import-Module SimplySQL
Import-Module CredentialManager
Import-Module -Name VMware.VimAutomation.Core
Import-Module PureStoragePowerShellSDK
Import-Module -Name VMware.VimAutomation.HorizonView
Now we use CredentialManager to get the logins for MariaDB and vCenter and then connect to them.
$creds = Get-StoredCredential -Target databaseLogin
Open-MySqlConnection -Server x.x.x.x -Database "sysdata" -Credential $creds -ConnectionName "sysdata"

$creds = Get-StoredCredential -Target domain\user
Connect-VIServer -Credential $creds -Server vcenter1 | Out-Null
You will need to setup these logins in Windows Credential Manager on the Windows server under an account that will also run the Powershell script as a scheduled task. This step is important, as Credential Manager will not find the stored logins if the script is run under any other account. Task Scheduler will be used to run the script on a schedule, and the job will be configured to use the same account. This method allows for using different logins in scripts without exposing them and store them securely. Naturally the login for the database should match the user you created in MariaDB.
Now we get all of our hosts, then query each one for the last aggregated realtime cpu, network, disk, and memory metric. We also grab a count of powered on VMs. The data is then stored in MariaDB.
$esxhosts = Get-VmHost | select Name

foreach ($esxnames in $esxhosts) {

$esxserver = $esxnames.Name
$vmcount = get-vm -Location $esxserver | where {$_.PowerState -eq "PoweredOn"} | measure | select count
$runVms = $vmcount.Count
$avgNet = Get-VmHost $esxserver | Get-Stat -Stat net.usage.average -Realtime -MaxSamples 1 -Instance ""
$avgDisk = Get-VmHost $esxserver | Get-Stat -Stat disk.usage.average -Realtime -MaxSamples 1 -Instance ""
$avgCPU = Get-VmHost $esxserver | Get-Stat -Stat cpu.usage.average -Realtime -MaxSamples 1 -Instance ""
$avgMem = Get-VmHost $esxserver | Get-Stat -Stat mem.usage.average -Realtime -MaxSamples 1 -Instance ""

Invoke-SQLUpdate "INSERT INTO HostStats (avgNetKBps,avgDiskKBps,esxHost,Location,avgCPU,avgMem,NumVMs) VALUES ('$avgNet','$avgDisk','$esxserver','Atlanta','$avgCPU','$avgMem','$runVms')" -ConnectionName "sysdata"
}
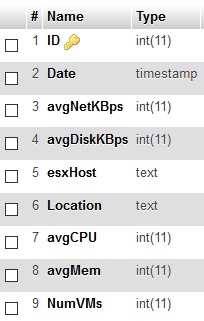
Note the column names in the SQL query, and the table structure is below. The Date field will get the current time as a value when we write to the table and is required or you won’t be able to graph it as a time series in Grafana. The Location field is used in my case to denote a physical city and you can use, modify, or remove it as needed.
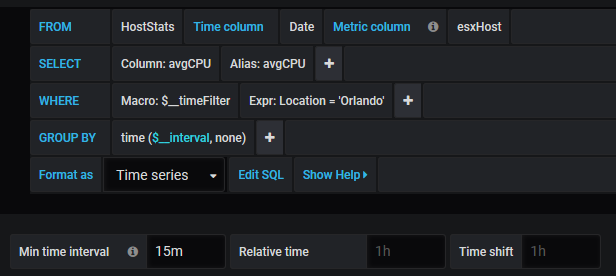
Here is the Grafana SQL for the host CPU graph. Repeat for the other metrics by duplicating the first graph and changing the column in the SELECT section.
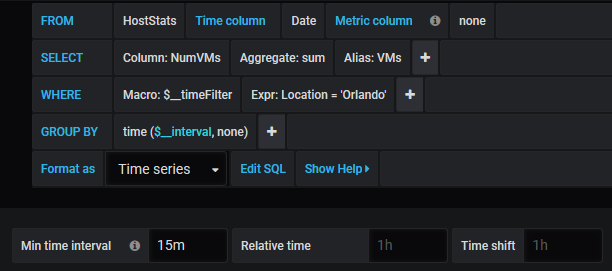
Here’s the Grafana SQL for the Total Running VMs graph. Here the value is summed to show a total, but it could also be displayed per host.
You should now have a new Grafana dashboard with your ESXi performance data. In the next post I’ll cover the View connections, ready time, and commit graphs.
Ready for part 2!
Nice work!